Maps Reveal Intersection of Race and Philly Parish Closures
28 January 2021

Author's note: As a graduate fellow at the Center for Digital Humanities, I worked on GIS mapping to supplement the more familiar archival and ethnographic research methods of my field, religious studies. I presented this research, as part of my dissertation, “Just and Grave Causes: Decline as Religious Change in Catholic Philadelphia,” at the annual American Academy of Religion conference in December.
For nearly a century, St. Lucy stood as one of five Roman Catholic parishes within just one square mile in Manayunk, north of Center City Philadelphia. This remarkable density reflected an era when the Church invested heavily in its brick-and-mortar institutional presence. As new ethnic communities settled in neighborhoods like Manayunk, they built their own churches, along with schools and rectories, sometimes only blocks from the next. In this way, Manayunk became home to the Italian St. Lucy Church, two blocks north of the German St. Mary of the Assumption Church, and only five blocks from the Polish St. Josaphat Church.
By the 2010s, however, the Archdiocese of Philadelphia decided that Manayunk no longer needed five parishes. In 2012, the neighborhood’s parishes dropped from five to two.
St. Lucy, St. Mary of the Assumption, and St. Josaphat were among the approximately 130 parishes the Archdiocese of Philadelphia closed between 1950 and 2019. Nearly half took place in the last decade alone. My dissertation considers this history of parish closures and the changing Catholic presence in Philadelphia. As a student of American religious history, I argue that decline, howsoever communities define or contest it, must be understood as a type of complex, nonlinear change resulting in innovative religious practice and discourse.
Maps balance the place-specific histories and narratives of archival and ethnographic research with visualizations of religious change at the institutional level. With this mixed-method approach, I can ask: where do parish closures happen? Why? And to whom?
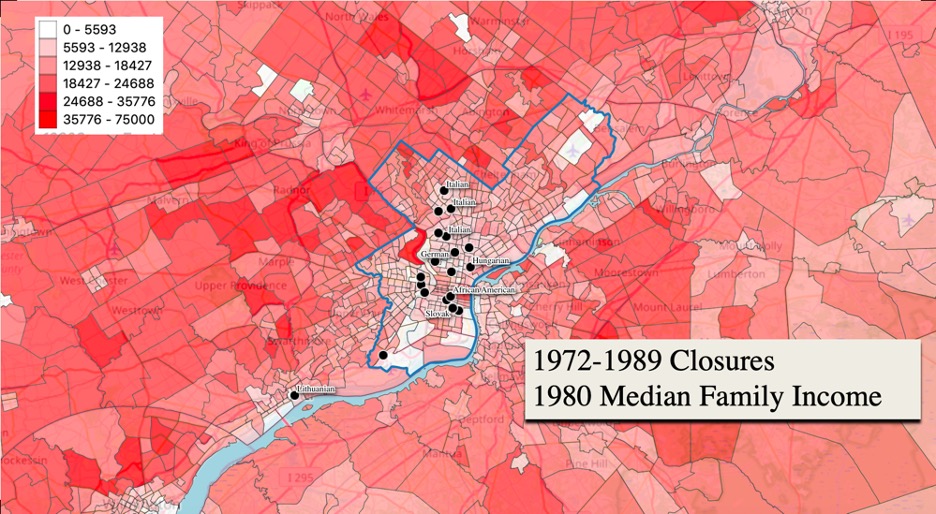
Philadelphia’s Church began to close parishes in the 1970s. The archdiocese was grappling with shortages of priests and other resources, changing demographics, and aging physical plants. At the same time, local and federal policies invested in Philadelphia’s surrounding suburbs and disinvested in the urban core; the city’s population and industrial base shrank.
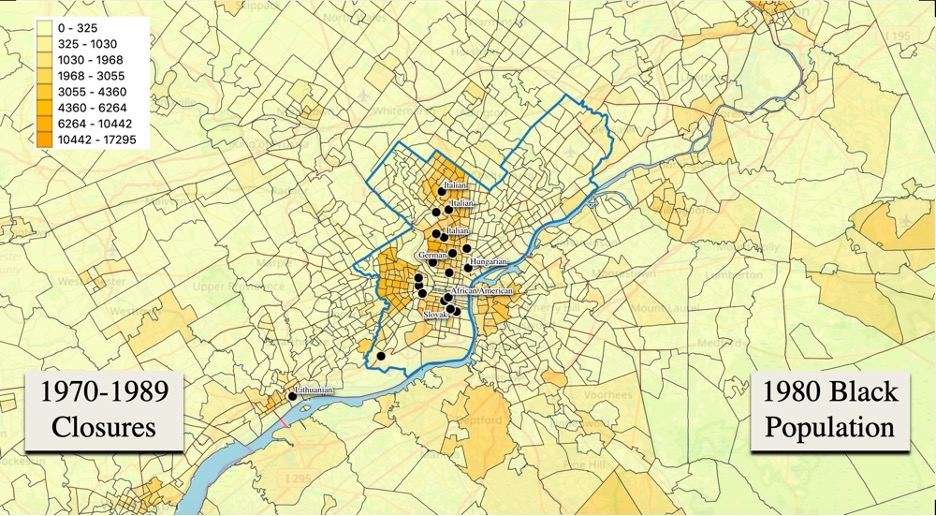
By overlaying a map of these early parish closures (marked as black points) with demographic data from the US census, GIS reveals a striking pattern: disproportionate closures in low-income, Black urban neighborhoods. In other words, parish closures and the disinvestment in the so-called inner city were not separate issues in the late 20th century. They were deeply intertwined.
Take a look at the image below. On 12th and Lombard streets stands St. Peter Claver, which the archdiocese established in 1887 as its first parish designated for Black Catholics.
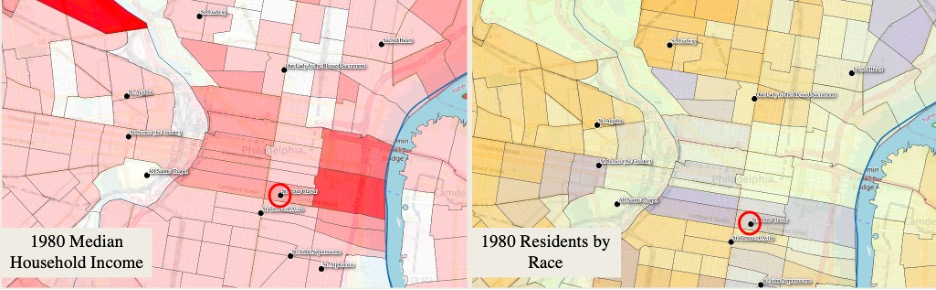
When the archdiocese closed the parish in 1985, it pointed to demographic change. Until the 1950s, this Center City neighborhood was the heart of Black Philadelphia, made famous by W. E. B. DuBois’s study, The Philadelphia Negro (1899). By the 1980s, however, the neighborhood had gentrified and become increasingly white. As with the closures in predominantly Black neighborhoods of North Philadelphia or Chester, the archdiocese maintained that it was “a fact of life” that parishes closed as neighborhoods changed. In the case of St. Peter Claver, the archdiocese argued there was no longer a need for a Black parish in the neighborhood.
But archival records, interviews with former parishioners, and Catholic practice itself complicate this narrative. St. Peter Claver parish was not in financial debt. If there had been a decrease in events and attendance, parishioners argued this was only a recent development, due to a series of disengaged replacements after a beloved priest’s death. Moreover, the archdiocese’s own study of the parish in 1984 strongly recommended that it remain open because of its historic significance. The report stated that St. Peter Claver’s closure would look like targeting Black Catholics.
The archdiocese closed it anyway.
In response, parishioners, clergy, and sisters (nuns) protested the archdiocese’s insistence that St. Peter Claver’s closure, like others in the late twentieth century, had nothing to do with race. By mapping these trends, we can perhaps begin to understand why the archdiocese estimates that it serves fewer Black Catholics today than fifty years ago.
If GIS mapping can reveal trends in religious change and decline, questions of causality remain live. We see where parish closure happens, and perhaps to whom it happens, but answering why involves the careful parsing of these historical and contemporary narratives, texts, and fragments.
In other words, closures are not “facts of life,” but institutional choices that allocate coveted resources, and in so doing preserve some communities and not others. These maps, together with historical and ethnographic sources, illuminate the spatial and racial connotations of institutional choices shaping Church presence, absence, and preservation: where decline happens, why it happens, and to whom it happens.
Carousel image: Maps show that many Philadelphia parish closures from 1970 to 1989 occurred in areas with large Black communities (in darker yellow) and smaller white communities (in lighter purple).